How To Make Your Own Seismicity Map

Images like the one above, showing the location of earthquakes that have occurred within a given time period, are called seismicity maps. In this article, I'll show you how to make your own seismicity maps using the user-friendly tools available at www.iris.edu.
IRIS (Incorporated Research Institutions for Seismology) is a university research consortium dedicated to the collection and distribution of seismological data. At IRIS, you can search earthquake catalogs, obtain information about seismic stations, download seismological data and much more. Some of these possibilities will be the subject of future How-To articles. But for now, let's get back to making seismicity maps.
The quick and dirty solution : ready made seismicity maps.
A great proportion of the seismicity maps requested by users are for standard time-periods before the date of the request. Therefore IRIS provides ready made seismicity maps and lists for the following time periods (click on a link to obtain the web page that includes the corresponding seismicity map):
- past 24 hours : http://www.iris.edu/quakes/tfhour.html
- past 7 days : http://www.iris.edu/quakes/week.html
- past 30 days : http://www.iris.edu/quakes/month.html
- past 365 days : http://www.iris.edu/quakes/year.html
 On the right-had side of these seismicity web pages, you'll see a map configuration pannel like this one on the left.
You can choose to scale the map to the data, zoom in and out, reduce the region to be mapped by choosing its latitude and longitude limits, select the type of map, plot plate boundaries, and set the map title.
In order for the map to be redrawn you must click on the Make Map button.
In order to save a local copy of the map, you can download a postscript version by clicking on the Download Postscript link, or you can download a .gif version by right clicking on the image itself, then selecting Save Image As option and entering a filename.
Seismicity maps made to measure
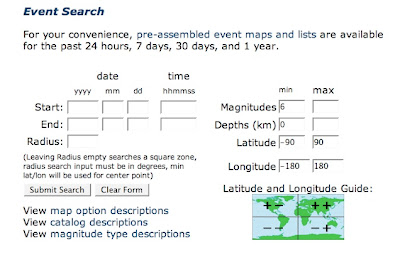
If you would like to create a seismicity map for a time period other than the ones listed above, you must start at IRIS's Event Search page: http://www.iris.edu/quakes/eventsrch.htm. The page looks like this:
 Enter the start and end of the time period you are interested in (e.g. 2004 12 25 000000, 2005 01 01 000000, for the time period between Dec 25, 2004 and Jan 1, 2005, which will include the great Sumatra earthquake).
Choose the geographical region of interest. The default values will give the whole globe as for the ready made seismicity plots above. If you are interested in a rectangular area, define it using the min/max latitude and min/max longitude boxes. If you are interested in a circular area, define the center of the circle using the min latitude and min longitude boxes, and its radius (in degrees) using the Radius box.
You may also select magnitude limits (e.g. 7.5, 10.0 to retain only large earthquakes), and limits on the depth of the earthquake.
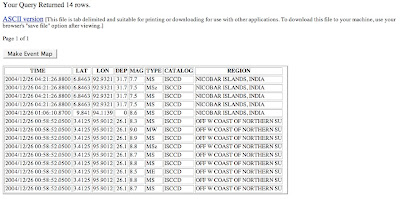
Once your event search is configured, click on the Submit Search button. You will reach a page that looks something like this:
 This page contains a listing of all the seismic events that satisfied your search criteria. You can download an text formatted table of these events using the ASCII version link. This is useful if you wish to use your own plotting software to make the seismicity map.
Otherwise you should click on the Make Event Map button. This will take you to a map page identical to the ready-made map pages described above. You can configure the map parameters, then regenerate the seismicity map.
As before, in order to save a local copy of the map, you can download a postscript version by clicking on the Download Postscript link, or you can download a .gif version by right clicking on the image itself, then selecting Save Image As option and entering a filename.
Getting some practice...
I suggest you practice making seismicity maps by making one or more of the following:
- a seismicity map containing all the earthquakes that have occurred during your lifetime;
- a 10 year seismicity map that approximately covers your own country ;
- a 20 year seismicity map of Antarctica and its surrounding oceans.


1 comment:
That's really cool. It takes a long time for the pages to load, but there was a lot of information on the map I looked at. And your directions were fine for me.
Post a Comment