How To Rapidly View Earthquake Records
Most of you have at one time or another heard on the news that an earthquake has happened somewhere in the world. A number of you have even felt one. If you'd like to view what seismologists see when an earthquake occurs, read on, as I run you through using Rapid Earthquake Viewer.
Start by visiting the REV site: http://rev.seis.sc.edu/index.html. You will be see a page like this:
There are two buttons on this page: Earthquake View and Station View. I would encourage you to play with all the possibilities offered by the site. Here, I will show you how to use the Earthquake View. When you click on the button, you will reach the page shown below (the page you see will not necessarily be identical to that shown here, as the page displays a dynamic collection of recent moderate to large earthquakes).
To choose an earthquake, click on the map. If there are multiple earthquakes near the one you have chosen, you will be presented with a short list from which to choose. Once you have selected your earthquake, you will be taken to its display page. This page is divided into three main sections, only two of which are shown in the picture above.
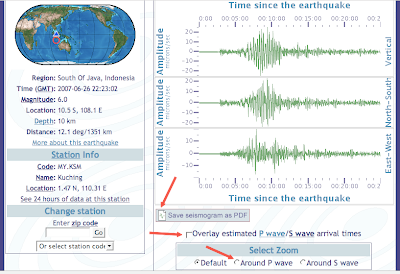
- On the left you have the ID card of the earthquake (it's origin time, magnitude, location and depth) together with a map containing the earthquake location and those of a number of seismic stations.
- On the right you have a record section. On this plot, time increases upwards, and the seismograms are plotted according to the distance of the seismic station from the earthquake. Note how the shape of the seismogram changes with distance. Seismologists use these differences to determine the location of the earthquake.
- On the bottom (not shown) you have a list of the stations used to plot the record section. You can add stations by selecting them from the Add a station drop down.
 From this page you can save the seismograms as a pdf file. You can also overlay the predicted arrival times of primary (P) and secondary (S) seismic waves, and zoom in on the seismograms.
The Rapid Earthquake Viewer website has many other options, which I encourage you to discover yourself. You can also work through the following pdf file from IRIS: Rapid Earthquake Viewer (REV) Activity: "Did The Earth Shake Where You Live?"
Don't forget to let me know you how you get on !
-----
Keep up to date with the latest developments at http://sismordia.blogspot.com


3 comments:
Extraordinary post!! Seismology topic! Earthquake and other related sources! Keep it up!!
This offers a a much better understanding of the phenomenon.Thanks a lot for the focus on earthquakes which kill so many thousands every year all over the world.And the first line of defence is awareness.And it is nice that we have an organisation (GeoHazards) working on Earthquake Safety in our list of NGOs to support.The world needs to understand that this is a threat where the damage can actually be reduced!
Thank you Hari for your comment. It's also great of you to mention GeoHazards, an NGO I have always taken a great interest in. I will probably write a post about GeoHazards soon, to give it more exposure.
Should you have any more suggestions about worth-while organizations to feature in the blog, do let me know.
Post a Comment