Friday, June 29, 2007

Concordia Science #1 - AstroConcordia

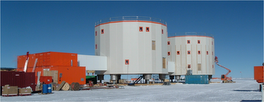
Seismology is not the only science programme being run at Concordia. In fact, seismology is only a small experiment compared to some of the others being run at the base. One of the larger scientific programs is AstroConcordia. Read on to find out more.

The AstroConcordia program, which is run by the Nice University Laboratory of Astrophysics, aims to qualify the Dome C site for astronomy. In order for a site to be good for astronomy, it must have clear skies for a good part of the year, but also a calm atmosphere, as atmospheric turbulence can perturb ground based observations.

The quality of a site can be measured by a number of experiments, many of which have been running at Concordia for two winters, now. Preliminary results have shown that the Dome C site is exceptional for astronomy. The climate at Concordia is extreme, so it is necessary to test the mechanical properties of all instruments to the enviromental conditions.

The Concordia base website lists the following astronomy experiments being currently run at the base:

DIMM (Differential Image Motion Monitor) and GSM (Generalized Seeing Monitor), which measure parameters of the atmospheric turbulence, in order to quantify the seeing quality of the site.

SSS (Single Star Scidar) measures the distribution of turbulence as a function of altitude.

MOSP measures the external scale of atmospheric turbulence by analyzing the deformations of images of the moon. The measurements obtained by this instrument complement those obtained by GSM.

PAIX is a camera that measures the photometric quality of the night sky. It is mounted on the same telescope as MOSP, but is used only during the nights with no moon.

GIVRE is an experiment designed to study the formation of frost on future telescopes, and to determine its dependance on the differential temperature of different parts of the instruments, and of the duration of heating.

SONICS determines the quality of low altitude turbulence, using sonic probes at 10, 20 and 30 m elevation to measure the wind speed in three dimensions.

SKY-CAM
is a wide angle camera (120 degrees) that continuously observes the night sky in order to quantify cloud cover.

For more information, you should read the AstroConcordia web page on the Concordia site, and the following two International Polar Year Projects:

-----
Keep up to date with the latest developments at http://sismordia.blogspot.com

Wednesday, June 27, 2007

Expedition planning #2 - A ton of batteries.

Antarctica is a long way away from Europe, so equipment needs to be shipped a long time in advance. Especially heavy equipment that must travel by ship.

Although we ourselves will not be leaving for Antarctica until next December, we have already purchased and sent more than a ton of stuff (literally!):

  • 50 lead batteries - weight: 940kg - volume: 0,42 cubic meters
  • 6 galvanized steel masts + accessories - weight: 90kg - volume: 0.75 cubic meters
The batteries will be used to power our seismic stations during the Antarctic night (we should be able to keep recording for approximately two months after sun-down).

The masts are for radio-transmission of state-of-health information from our stations back to the Concordia base, so we can keep an eye on things.

-----
Keep up to date with the latest developments at http://sismordia.blogspot.com

How To Rapidly View Earthquake Records

Most of you have at one time or another heard on the news that an earthquake has happened somewhere in the world. A number of you have even felt one. If you'd like to view what seismologists see when an earthquake occurs, read on, as I run you through using Rapid Earthquake Viewer.

Start by visiting the REV site: http://rev.seis.sc.edu/index.html. You will be see a page like this:


There are two buttons on this page: Earthquake View and Station View. I would encourage you to play with all the possibilities offered by the site. Here, I will show you how to use the Earthquake View. When you click on the button, you will reach the page shown below (the page you see will not necessarily be identical to that shown here, as the page displays a dynamic collection of recent moderate to large earthquakes).


To choose an earthquake, click on the map. If there are multiple earthquakes near the one you have chosen, you will be presented with a short list from which to choose. Once you have selected your earthquake, you will be taken to its display page.

This page is divided into three main sections, only two of which are shown in the picture above.

  1. On the left you have the ID card of the earthquake (it's origin time, magnitude, location and depth) together with a map containing the earthquake location and those of a number of seismic stations.
  2. On the right you have a record section. On this plot, time increases upwards, and the seismograms are plotted according to the distance of the seismic station from the earthquake. Note how the shape of the seismogram changes with distance. Seismologists use these differences to determine the location of the earthquake.
  3. On the bottom (not shown) you have a list of the stations used to plot the record section. You can add stations by selecting them from the Add a station drop down.
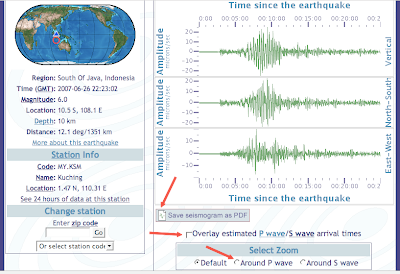
If you click on one of the station names in the bottom panel, you reach another page, showing the three components (up-down, north-south, east-west) of the ground motion recorded at the station. On this plot you can see the units of ground motion, which is in fact the ground velocity measured in microns/sec (1 micron = 1/1000 of a millimeter).

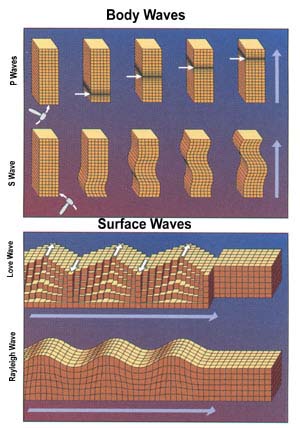
From this page you can save the seismograms as a pdf file. You can also overlay the predicted arrival times of primary (P) and secondary (S) seismic waves, and zoom in on the seismograms.

The Rapid Earthquake Viewer website has many other options, which I encourage you to discover yourself. You can also work through the following pdf file from IRIS: Rapid Earthquake Viewer (REV) Activity: "Did The Earth Shake Where You Live?"

Don't forget to let me know you how you get on !

-----
Keep up to date with the latest developments at http://sismordia.blogspot.com

Tuesday, June 26, 2007

Antarctic test stations: IRIS/PASSCAL


IRIS/PASSCAL have been funded by the NSF to develop and test robust, scalable power and communication systems that can operate for several years in severe polar environments (read Antarctica). You can read more about the project here: Polar Permanent Stations MRI Project: Year 1 Field Season

Tests of these systems are have been under way since February 2007, at South Pole and McMurdo research stations, and the Year 1 Midseason Report, dated March 19th, 2007, is available for download (in pdf). This report gives details on the choice of primary power source (lithium thionyl cholride batteries), the method of switching from primary to auxiliary (solar) power, and the insulating enclosures which permit the electronics to work despite the severe temperature of the Antarctic.


----
Keep up to date with the latest developments at http://sismordia.blogspot.com

Monday, June 25, 2007

Antarctic WebCams

Many of the Antarctic research stations have webcams showing the current conditions. Here is alist of some I have found.

Most of the images will be dark at this time of year. Follow along as the sun starts returning, and we move inexorably away from midwinter towards the Antarctic summer.

Links to most of these web-cams are available at www.webcam-index.com.


-----
Keep up to date with the latest developments at http://sismordia.blogspot.com
Sunday, June 24, 2007

Featured earthquakes #1

As soon as I write about earthquakes surrounding Antarctica, a nice one occurs right on cue, a M5.8 on the Southern Mid-Atlantic Ridge.

Origin time: Sunday, June 24, 2007 at 00:25:18 (UTC). Location: 55.574°S, 2.763°W.

It wasn't felt by anyone, it did not make the news. This is not unusual for earthquakes: many more occur than are ever felt or talked about. If we know about them at all it is thanks to the global seismic network.

As with all earthquakes larger than magnitude 5, you can read all the details on the USGS website. The link for this earthquake is here: M5.8 Southern Mid Atlantic Ridge.

You can find all the available data for this earthquake on the IRIS website. The following is a vertical component seismogram recorded at the Antarctic seismic station CASY.


-----
Keep up to date with the latest developments at http://sismordia.blogspot.com

Friday, June 22, 2007

From Pietro Di Felice #1


This post was contributed by Pietro Di Felice, the current head of the Concordia winter-over team. The text is in Italian. If you would like to read an English version, please leave me a comment, and I'll get to work on a translation.


Chi ben comincia è a metà dell'opera!!! dice così il detto o sbaglio?!?!!?! e noi qui nel profondo ombelico del mondo (si chiamiamolo pure ombelico :-)))) siamo arrivati a metà inverno, in gergo detto midwinter.

Da ora in poi mancano alla fine dell'isolamento meno giorni di quanti ne sono già passati e questo per noi è un bel traguardo.......ebbene si anche noi viviamo di stimoli e questa è una bella spinta ad arrivare in fondo. I nostri calendari si riempiono di segni neri ad indicare le giornate che passano, chi ci mette una semplice croce, chi annerisce settimana dopo settimana, tutto per scandire il tempo che passa.

E anche le aurore hanno fatto la loro comparsa, solo tre volte finora e poco visibili per la verità, offuscate, ma speriamo che prima della fine della notte polare ci degnino dello spettacolo maestoso degli altri anni.

Questo solstizio d'estate (per noi d'inverno) sarà un evento che resterà nel mio cuore a vita. Niente di speciale, niente raggi solari particolari o lucette strane tipo luna park, solo il buio assoluto ma la consapevolezza che stiamo invertendo la nostra direzione, un pò come uno space shuttle che ha terminato la missione e riprende la strada di casa il nostro.

La luce del sole che oggi intravediamo solamente in lontananza all'orizzonte in un crepuscolo arancione - violaceo pian piano tornerà a far parte delle nostre giornate, lentamente ma inesorabilmente, come per incanto.......

So che per chi vive nel mondo "noramle" il sole in questi giorni dell'anno comincia ad essere quasi una noia, tutto quel caldo e l'appiccicume che l'umidità si porta appresso devono essere una vera frustrazione, il dover passare le giornate rinchiusi in ufficio col condizionatore acceso al massimo per lenire le fatiche estive..... come vi capisco!!!!!!

Anche qui il clima è bizzarro; a volte la temperatura scende oltre i 70 gradi sotto zero senza un fil di vento e in cielo non c'è nemmeno una nuvola a corpire quell'immenso manto di stelle che rende magico questo posto e allo stesso tempo da lavoro agli astronomi che sono venuti qui sperando di portare a casa un risultato altrimenti irraggiungibile altrove.

Altre volte soffia il vento, così forte che quando sei disteso nel letto ti senti cullare dalle poderose raffiche che spazzano tutt'intorno la base, e la nebbia che ci avvolge impedendoci di vedere più lontano dei nostri nasi. Oppure altre volte la temperatura che sale sopra i -50 gradi e l'umidità che aumenta un pò donando pace alle nostre mucose aride.

La scarsa umidità e la carenza d'ossigeno ci ci portano a qualche problema di salute, come la secchezza della pelle e delle mucose del naso che spesso sanguinano, ma anche più seri come carenza nella memoria che a volte fa cilecca.

Poi l'assenza di un ciclo solare "normale" comporta sfasamenti nel sonno che sono più o meno marcati a seconda anche dell'umore che ha un andamento altalenante........

Vabbè, ora vi saluto, iniziano i festeggiamenti, lo champagne è pronto, il cuoco ha preparato la cena a base di pesce (ostriche, gamberi, salmone ecc ecc...) e c'ho fame, quindi buon solstizio a tutti voi, e se andate sul sito http://www.concordiabase.eu/ vi potete scaricare la cartolina dell'evento che purtroppo non riesco a spedirvi poiche è troppo pesante.


Un abbbbbbbraccione
Pietro polare....tto


CONCORDIA - 2007/06/22 12:59Temp=-50.3°C WindChill=-72°C RH=47% P=641.4hPa Wind=8.7m/s S


-----
Keep up to date with the latest developments at Sismordia - Seismology at Concordia

Thursday, June 21, 2007

Antarctica : surrounded by earthquakes

If you're thinking: "Earthquakes in Antarctica? I did not think there were any!" you'd not be far wrong.

Although there are a few seismic events in Antarctica, these are generally small in magnitude, and often remain undetected by the global seismic network. Indeed, one of the objectives of running seismic experiments in Antarctica during the International Polar Year is to detect more of these earthquakes.

Although Antarctica is not itself particularly seismically active, it is, however, completely surrounded by earthquakes.

You may already have heard of the "ring of fire", that surrounds the Pacific ocean. It is made up of subduction zones that are capable of producing very large earthquakes. Antarctica has its own, much weaker ring of earthquakes, as you can see in the seismicity map that accompanies this post. These earthquakes are produced by a network of mid-ocean ridges that completely surround the continent, and that can generate moderate to large earthquakes.

For a seismologist, being surrounded by earthquakes is a great advantage. Each earthquake acts as a light bulb, illuminating the Earth, and enabling us to study its structure. Improving our knowledge of Earth structure is one of the main objectives of our seismology experiment (see Concordia Antarctic Seismic Experiment). I'll be developing this idea further in future posts.

[Image: constructed using Seismicity Viewer, a java applet written by Anthony Lomax, a fellow seismologist.]

-----
Keep up to date with the latest developments at Sismordia - Seismology at Concordia

Wednesday, June 20, 2007

Blog by email now available

Remembering to come back here every few days to check up on the latest news may not be your kind of thing. You may want to be kept up to date without the hassle of navigating and clicking.

For users like you, I have added "Read this blog by email" capabilities to the Sismordia blog. You will be able to submit your email address, and receive the latest posts directly in your inbox.

Be the first to try out this new service !

Piercing the mysteries of Lake Vostok

The Russian scientific base Vostok lies almost directly above an immense sub-glacial lake, Lake Vostok. The lake, which is hidden under more than 3km of ice, is the size of Corsica.

Lake Vostok is as yet untouched. Scientific pressure to directly sample the lake's water is strong. However it is currently counterbalanced by concerns about contaminating the lake by external life-forms transported by the sampling equipment.

How long this balancing act will continue is unknown. Le Figaro published an article yesterday, Antarctique : la Russie veut percer les mystères du lac Vostok, on Russia's intention to pierce through to the lake next year.

The Russian plan involves extending the current Vostok ice-core drill shaft, which currently stops 90 m above the lake surface, by another 70 m, until it reaches 20 m above the water. The second step will be to continue drilling with a small diameter thermal probe which will reach the lake itself. Lake water will then rise up the drill hole, where it will freeze. The then frozen lake water will be extracted by drilling this new ice-core.

There may be other ways to sample frozen water from Lake Vostok. Researchers from the Lamont-Doherty Earth Observatory at Columbia University believe that the surface of the lake naturally freezes onto the bottom of the ice-cap, and is dragged along with the ice as it descends slowly towards the Antarctic ocean.

The Columbia researchers suggest the entire volume of the lake is removed every 13,000 years. They have put together this very clear Lake Vostok water animation explaining their findings. The source of the replacement water remains a mystery, but it may have something to do with the interconnectedness of the sub-glacial Antarctic lakes.


Tuesday, June 19, 2007

Midwinter 2007

Midwinter... in June ??

Sure, if you're in the southern hemisphere...! While all the northern hemisphere residents celebrate the longest day of the year, the Southern hemisphere residents endure their longest night.

It has long been a tradition in Antarctica to celebrate Midwinter with festivities and dinners. What exactly goes on in the various scientific bases is little known, apart from that made public by the residents themselves, but much lively and drunken fun is to be expected.

Amongst the various Midwinter traditions are the Greetings Cards made by each over-wintering team, and sent to all the other scientific bases.

Here are a list of blog-posts I have found on this year's Midwinter celebrations. Should you know of any more that could be included, let me know!

Also, should you wish to send Midwinter greetings to the over-winter team at Concordia or at one of the other Antarctic bases and don't know how to do so, please leave them in a comment and I'll make sure they get delivered.

Stealing the South Pole

If you want to read a funny story about Antarctica, try out this post by icewol on everthing2. A great story about stealing the true South Pole marker (not the ceremonial maker shown in the photo), filled with details of life at South Pole, and lots of humor.

If you have any Antarctic stories of your own, or want to recommend any you have read, please drop me a comment. I'll include some of them in this blog.

Monday, June 18, 2007

Expedition planning #1 - Expedition dates set

Despite still not having any funding news yet, the plans for our Antarctic summer campaign are well underway.

There are not too many routes one could take to get to Antarctica. A lot depends on the polar institute that provides the logistical support. In our case, this is IPEV (Institut Paul Emile Victor), the French polar institute.

We will most likely be traveling on the French ice-capable ship, the Astrolabe. You can find details about the ship, as well as pictures and a video of the Astrolabe advancing through the pack on these IPEV web pages [in French].

We now have provisional dates for our expedition : 26 December 2007 - 20 February 2008. Nearly two months to get to Concordia, do some maintenance on the seismometer in the ice cave, set up our field experiment, test everything to death, and get back.

In my first post, I wrote about this experiment becoming more and more real as the planning advanced. Setting these provisional dates is another step towards making it all happen.

[Photo: See IPEV credits page]

Sunday, June 17, 2007

Aurora time-lapse photography

Anthony Powell, the time-lapse photographer whose work I've already plugged in a previous post (Great Antarctic time-lapse photography) has struck again.

He was back in Antarctica (for his wedding), and during a short visit to Scott base recently shot more time-lapse footage of the Antarctic Aurora. This footage is truly spectacular, well done Anthony!

I encourage you all to read the original, detailed Aurora Australis post on the Antarctic conservation blog to find out more...

IPY news : Global Outlook for Ice and Snow

The Global Outlook for Ice and Snow is an IPY initiative sponsored by the United Nations. It investigates the current trends in ice and snow, their links with climate change and their consequences, and has produced a peer reviewed report with contributions from over 70 scientists.

If you're interested in the current state of knowledge about ice and snow as we head into the International Polar Year, you should go visit their website. It is very well constructed and is simple to navigate and fascinating to read.

Saturday, June 16, 2007

How To Make Your Own Seismicity Map


Images like the one above, showing the location of earthquakes that have occurred within a given time period, are called seismicity maps. In this article, I'll show you how to make your own seismicity maps using the user-friendly tools available at www.iris.edu.

IRIS (Incorporated Research Institutions for Seismology) is a university research consortium dedicated to the collection and distribution of seismological data. At IRIS, you can search earthquake catalogs, obtain information about seismic stations, download seismological data and much more. Some of these possibilities will be the subject of future How-To articles. But for now, let's get back to making seismicity maps.


The quick and dirty solution : ready made seismicity maps.

A great proportion of the seismicity maps requested by users are for standard time-periods before the date of the request. Therefore IRIS provides ready made seismicity maps and lists for the following time periods (click on a link to obtain the web page that includes the corresponding seismicity map):


On the right-had side of these seismicity web pages, you'll see a map configuration pannel like this one on the left.

You can choose to scale the map to the data, zoom in and out, reduce the region to be mapped by choosing its latitude and longitude limits, select the type of map, plot plate boundaries, and set the map title.

In order for the map to be redrawn you must click on the Make Map button.

In order to save a local copy of the map, you can download a postscript version by clicking on the Download Postscript link, or you can download a .gif version by right clicking on the image itself, then selecting Save Image As option and entering a filename.


Seismicity maps made to measure

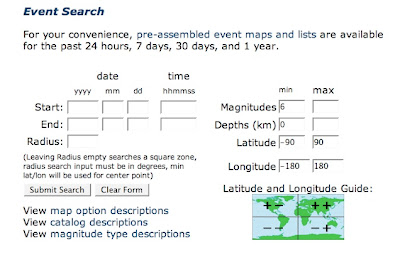
If you would like to create a seismicity map for a time period other than the ones listed above, you must start at IRIS's Event Search page: http://www.iris.edu/quakes/eventsrch.htm. The page looks like this:

Enter the start and end of the time period you are interested in (e.g. 2004 12 25 000000, 2005 01 01 000000, for the time period between Dec 25, 2004 and Jan 1, 2005, which will include the great Sumatra earthquake).

Choose the geographical region of interest. The default values will give the whole globe as for the ready made seismicity plots above. If you are interested in a rectangular area, define it using the min/max latitude and min/max longitude boxes. If you are interested in a circular area, define the center of the circle using the min latitude and min longitude boxes, and its radius (in degrees) using the Radius box.

You may also select magnitude limits (e.g. 7.5, 10.0 to retain only large earthquakes), and limits on the depth of the earthquake.

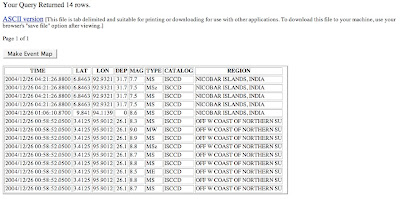
Once your event search is configured, click on the Submit Search button. You will reach a page that looks something like this:

This page contains a listing of all the seismic events that satisfied your search criteria. You can download an text formatted table of these events using the ASCII version link. This is useful if you wish to use your own plotting software to make the seismicity map.

Otherwise you should click on the Make Event Map button. This will take you to a map page identical to the ready-made map pages described above. You can configure the map parameters, then regenerate the seismicity map.

As before, in order to save a local copy of the map, you can download a postscript version by clicking on the Download Postscript link, or you can download a .gif version by right clicking on the image itself, then selecting Save Image As option and entering a filename.


Getting some practice...

I suggest you practice making seismicity maps by making one or more of the following:
  • a seismicity map containing all the earthquakes that have occurred during your lifetime;
  • a 10 year seismicity map that approximately covers your own country ;
  • a 20 year seismicity map of Antarctica and its surrounding oceans.
Leave me a comment with a link to some of your seismicity maps.

East Antarctica permanent research stations

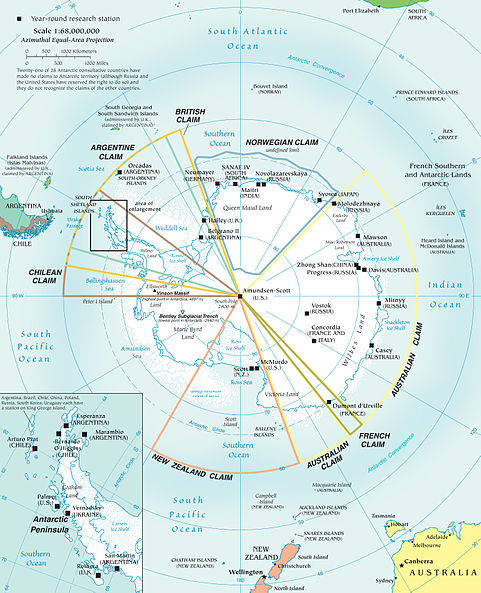
There are more research stations in Antarctica than you might think (and many more in the western part of the continent compared to the eastern part). It is surprisingly hard to get a complete and accurate list.

I've made a map, and a list of permanent East Antarctic research stations with links towards websites concerning them. For the click-lazy, I've put in italics some information from each website.

Amundsen-Scott South Pole (USA) - Americans have occupied the geographic South Pole continuously since November 1956. The station's name honors Roald Amundsen and Robert F. Scott, who attained the South Pole in 1911 and 1912.

Casey (AUS) - Casey is located in the Windmill Islands - just outside the Antarctic Circle - and is the third Australian station to occupy a site on Vincennes Bay.

Concordia (FRA + ITA) - The French (IPEV) and Italian (PNRA) Antarctic programmes have agreed to cooperate in developing a research programme that includes the construction and operation of a scientific base located at Dome C, high on the Antarctic plateau. Concordia Station has been opened since 2005 to the worldwide scientific community for conducting scientific research.

Davis (AUS) - Davis is the most southerly Australian Antarctic station and is situated 2,250 nautical miles south-south-west of Perth, at 68 ° 35' South, 77 ° 58' East, on the Ingrid Christensen Coast of Princess Elizabeth Land.

Dumont d'Urville (FRA) - Position (66°40'S - 140°01'E). Dumont d'Urville station is situated on Petrel Island, in the Geology Point archipelago, 5km away from the continent. [Website in French]

Maitri (IND) - In the year 1988-89 India built its second indigenous station Maitri at Schirmacher oasis, which is well equipped and facilitated to accommodate scientists, round the year and allow them to conduct their scientific experiments.

Mawson (AUS) - Mawson is situated on an isolated outcrop of rock on the coast in Mac.Robertson Land, at the edge of the Antarctic plateau at 67'36'S 6252'E. It is Australia's first continental station and the longest continuously operating station south of the Antarctic Circle.

McMurdo (USA) - McMurdo Station, located at 77 degrees 51 minutes S, 166 degrees 40 minutes E, is the largest Antarctic station. McMurdo is built on the bare volcanic rock of Hut Point Peninsula on Ross Island, the solid ground farthest south that is accessible by ship.

Mirny (RUS) - Mirny Observatory (opened on February 13, 1956) is situated on the coast of Cape Davis at a small protrusion of Mirny Peninsula at a point with coordinates of 66033’S and 93001’E. The altitude of the station above sea level comprises 35 m. The shore in the vicinity of the station is called Pravda shore.

Novolazarevskaya (RUS) - The Novolazarevskaya station is located at the extreme southeastern tip of the Schirmacher Oasis approximately in 80 km from the Lazarev Sea coast. An ice shelf with a slightly undulating surface resting against an ice cap extends north of the station in the vicinity of Leningradsky Bay. From the south, there is a continental ice sheet slope.

Princess Elisabeth (BEL) - In 2007-2008, Belgium will construct a new research station in Antarctica. This station will replace the former Belgian Roi Baudouin base, built in 1958 at Breid Bay in Dronning Maud Land, closed in 1967.

Scott Base (NZ) - Scott Base was constructed for New Zealand's participation in the Trans-Antarctic Expedition and International Geophysical Year and was officially opened on 20 January 1957. Although designed for a life of only a few years, the value of Antarctic research was soon recognised and a base re-building programme began in 1976.

Showa (JAP) - Latitude: 69°00' S. Longitude: 39°35' E. Sounding rocket launch site. In use from February 1970 to present.

Terra Nova Bay (ITA)

Vostok (RUS) - The Vostok station was opened on December 16, 1957. It is located on the snow surface of the ice plateau of Central Antarctica (with coordinates of 78 28'S and 106 48'E) in 1410 km from the Mirny station and in 1260 km from the nearest sea coast. The station height above sea level comprises 3448 m. The ice sheet thickness in this area is 3700 m.

For the latest updates to the full research station list, try consulting Wikipedia. Help me keep this post up to date by commenting on any mistakes or omissions you might find.


Concordia 2006 seismograms


Here is an example of data from the Concordia seismometer in early 2006 (March 31), as promised in this earlier post.

The whole day is split into 6 portions of 4 hours each, shown on separate lines from top to bottom. Each seismogram is plotted with time (in hours) increasing to the right. So the first line contains data for 00:00-04:00 UTC, the second line for 04:00-08:00 UTC and so on.

Seismic waves from an earthquake arriving at about 13:30 UTC are nicely recorded on the fourth line. This magnitude Mw 6.5 earthquake occurred at 31:21 UTC in the Kermadec Islands region, at a depth of 12 km.

Friday, June 15, 2007

Seismology definitions

Here you will find definitions of various seismological terms as they come up in the Sismordia blog. As more content becomes available, these simple definitions will be linked to posts going into greater detail about each topic.

Data recorder / acquisition system = an instrument capable of recording the signal produced by a seismometer. It also has the important task of time stamping the signal, so we can later reconstruct the exact timing of each feature.

Intensity = quantifies the ground shaking at a particular location. It is estimated both from instrumental recordings and the reports of those having felt the earthquake. Intensity values are given using the Modified Mercalli Intensity Scale.

Magnitude = a number that gives the relative size of an earthquake. It is related to the amplitude of the seismic signal. Four magnitude scales are commonly used: ML = local or Richter magnitude; Ms = surface wave magnitude; Mb = body wave magnitude; Mw = moment magnitude. Modern seismologists tend to prefer the Mw magnitude scale as it is applicable to earthquakes of any size.

Seismic source / seismic event = an event which triggers the production of seismic waves. Seismic sources are not limited to earthquakes. Volcanic tremors, explosions, oceanic storms, moving glaciers, iceberg breakups and collisions can all create seismic waves, as can human activity (power generators, transport etc.).

Seismic tomography = the process of making 3D images of the interior of the Earth from the information contained in seismograms.

Seismic waves = elastic waves that are produced by seismic events such as earthquakes. These waves travel through the Earth and along its surface, inducing ground motion which can in some cases create damage.

Seismicity map = map of locations of earthquakes that have occurred within a given time period.

Seismologist = a seismology researcher. Seismologists deploy seismometers, analyse the data they record, and try to deduce information about earthquakes and the Earth itself. They need a good understanding of physics, mathematics and computer programming.

Seismology = the study of earthquakes and the propagation of seismic waves. Seismology research has two broad goals: (1) learning more about how earthquakes happen and (2) learning more about how the Earth is constructed.

Seismogram = a recording of ground motion with time. Seismograms are the raw data used by seismology researchers. They indicate at each instance in time what the motion of the ground was under the sensor (seismometer).

Seismometer / seismic sensor = an instrument capable of detecting ground motion and turning it into a signal that can be recorded. Seismometers are to seismology what telescopes are to astronomy: indispensable!

UTC = Coordinated Universal Time, a universal "time zone" synchronized to Greenwich Mean Time (GMT). Seismic data is always recorded in UTC, so that it is easy to compare the times of seismic wave arrivals across the globe. The time-zone of this blog is also UTC.

Thursday, June 14, 2007

Wind power in Antarctica

Power is often a concern in Antarctica, where the costs of fuel transport scale with the difficulty of access.

Solar power can be used for low power consumption applications like stand-alone scientific experiments, but only when the sun is present, which is less than six months of the year.

Wind power is also an alternative, although the freezing temperatures present a considerable problem.

Antarctica New Zealand are in the very early stages of researching wind as an alternative power source, in order to lower their environmental footprint in Antarctica. They are currently evaluating if there is enough wind for a wind farm installation that would benefit both Scott Base and McMurdo. Read more about this initiative in this article by Sarah Bedford in the Southland Times.

What is Seismology?


I cannot maintain a blog about seismology in Concordia without giving you at least a brief run-through of some seismology basics. I'll go into more detail in future posts, so as to give you a greater feeling for the why and how of our experiment.

In the meantime, you will find more definitions and descriptions on the Seismology Definitions page.

Seismology
= seismos (earthquake) + logos (word, study)

Seismology is the scientific study of earthquakes and the propagation of elastic waves (seismic waves) through the Earth.

The events that generate seismic waves are called seismic sources. The most common seismic sources are tectonic (earthquakes related to plate tectonics) and volcanic (earthquakes that occur on volcanoes).

Recordings of seismic waves are called seismograms. Take a look at a seismogram from the Concordia seismometer at this post on Current seismology at Concordia.


For those of you who are impatient and would like to learn more about seismology, the USGS has a good series of explanatory web pages: http://earthquake.usgs.gov/learning/

Great Antarctic time-lapse photography

If you want a glimpse of what life on an Antarctic base can be like, do watch this fantastic time-lapse photography video by Antzartica on YouTube. It was filmed in and around McMurdo Station and Scott Base, and is divided in two sections, summer and winter. Highlights are the preparation of a runway (summer section), and the southern lights (winter section).

If you know of other great Antarctic videos, especially any set on the Plateau or in Corcordia, please let me know (write a comment), and I'll try to include them in this blog.

Tuesday, June 12, 2007

Antarctic Treaty

During the International Geophysical Year of 1957-58, scientists from 12 countries had worked in and around Antarctica. They had established bases in Antarctica, and had engaged in scientific cooperation despite their countries different claims of sovreignty over the continent. One year later, these same 12 countries signed the Antarctic Treaty.

The treaty guarantees the continued use of Antarctica exclusively for peaceful ventures, and the freedom of scientific investigation and cooperation in Antarctica.

The treaty starts thus: "Recognizing that it is in the interest of all mankind, that Antarctica shall continue forever to be used exclusively for peaceful purposes, and shall not become the scene or object of international discord..." Not so bad for a treaty written and signed during the Cold War !

Find out more about the Antarctic Treaty at the webpage of the Antarctic Treaty Secretariat. You can also find the full Antarctic Treaty here.

Sunday, June 10, 2007

Concordia Antarctic Seismic Experiment (International Polar Year)

So what exactly are we hoping to do during the International Polar Year? The short answer is study Earth structure.

The exact details of what we will end up doing are as yet unknown, dependent as they are on funding results, logistic possibilities, and the whims of equipment and nature. However, we do know what it is we hope to achieve.

Most if not all the projects that have been proposed for the IPY are listed in an Expression of Intent (EoI) Database maintained on www.ipy.org. The following is an excerpt of the EoI for our seismic experiment project (links within the excerpts are to Wikipedia entries for technical terms). Interested readers can find the full EoI here.

Concordia Antarctic Seismic Experiment for the International Polar Year (CASE-IPY)

We propose deploying 10 broad-band seismometers in Antarctica, starting at the French-Italian scientific base at Concordia, and trending southwards. Our deployment will be coordinated with those of our Italian, American and Australian colleagues in order to achieve maximum coverage of the Antarctica Plateau and to share a maximum of logistical support. Our combined deployments will allow us to improve our knowledge of the crustal and lithospheric structure of Antarctica, as well as to provide data for core studies.

Antarctic Geography

The geography of Antarctica can be pretty confusing at times. The concepts of North, South, East and West get turned on their head as soon as you approach the poles. So how should you plot Antarctica? Which way is up?

The generally accepted convention is to plot the Greenwich meridian going from top to bottom of the page (though actually it only goes to the center of the page, because from there on the meridian is 180 degrees away from the Greenwich meridan). Then all regions to the right of that line are referred to as East Antarctica (they are to the East of the prime meridian), and all regions to the left are referred to as West Antarctica (they are to the West of the prime meridian).

Antarctica itself is rather cooperative on this point: the East and West halves of the continent are very different, and they are separated by a large mountain range, the Transantarctic Mountains. The Western half is low-lying and convered by a thin layer of ice; it contains the easily recognizable Antarctic Peninsula, and is slowly increasing in area over time (it contains what Earth scientists call a rift system). The Eastern half has a high elevation (approx 3000m above sea level), is entirely covered by ice (3km thick - most of the high elevation is due to ice), and is geologically very old (geologists refer to regions like this as cratons).

The seismological experiments we are planning will take place in East Antarctica, high up on the ice Plateau.

Good resources for Antarctic geography are:

Saturday, June 9, 2007

Dumont d'Urville, Astrolabe and Terre Adelie


In the days of wood and sail, getting to Antarctica was an expedition in of itself. The French explorer Dumont d'Urville finally arrived within sight of the Antarctic continent on the 21st January, 1840. He then named the shore Terre Adélie, after his wife. Two ships participated in d'Urville's expedition, the Astrolabe, and the Zélée.

Today, the French scientific base on the Antarctic coast is called Dumont d'Urville, and the land it stands on is still called Terre Adélie. Astrolabe is the name of the ship used by the French polar institute (IPEV) to reach Antarctica.

For the history buffs, this post by Glenn Stein on www.ipy.org goes into great detail about the adventures of Dumont d'Urville.

Current seismology at Concordia

Seismology is already happening at Concordia. We have a seismic observatory some 12 meters deep, about 1 kilometer away from the base itself. The temperature within the seismic vault is a constant -59 degrees Celsius, much lower than what is reasonable for any mechanical instrument to be working at.

One of the members of the Concordia Winter Team for 2007, Pietro Di Felice, is making sure the seismometer keeps working correctly. Here is the web page he is keeping about his seismological work.

As communication with the base is both difficult and expensive, we cannot as yet obtain the data recorded by the Concordia seismometer in real time. We can ask Pietro to email us short bursts of data for specific earthquakes, but for the rest of the data, we have to wait until somebody actually goes to Concordia and brings them back.

We have recently received in this manner all the 2006 data. As soon as we've taken a good look at them, I'll try to put up some pictures.

What and where is Concordia?

Concordia is a European Antarctic base scientific research station located at Dome C (75S, 123E), high on the Antarctic plateau. It is about 1,100 km inland from Dumont D'Urville, the French Antarctic base, and 1,200 km inland from Terra Nova Bay, the Italian base.

You can find a lots of information about Concordia, including a map showing where it is with respect to other scientific bases, at their official website: http://www.concordiabase.eu . You can learn about the different scientific experiments being run there, and what life on a remote Antarctic base is like. For example, right now the temperature is about -50 degrees Celsius (even colder when you factor in the wind-chill). The Concordia team even have their own blog, and a guestbook you can go and sign (please be friendly, it's kinda cold and lonely out there).

This is where we will go to set up our IPY experiment. Cool or what?

What is the International Polar Year?

The International Polar Year is a large scientific programme focused on the Arctic and the Antarctic from March 2007 to March 2009.

IPY, organized through the International Council for Science (ICSU) and the World Meteorological Organization (WMO), is actually the fourth polar year, following those in 1882-3, 1932-3, and 1957-8.

In order to have full and equal coverage of both the Arctic and the Antarctic, IPY 2007-8 covers two full annual cycles from March 2007 to March 2009 and will involve over 200 projects, with thousands of scientists from over 60 nations examining a wide range of physical, biological and social research topics.

It is also an unprecedented opportunity to demonstrate, follow, and get involved with, cutting edge science in real-time.

[http://www.ipy.org ]

The environmental rigors of working in the polar regions make it neigh impossible for isolated experiments to take place. One of the advantages of working at the poles during the International Polar Year is the number of other people out there at the same time, the greater amount of logistics sharing that can happen, the improved safety conditions. Another advantage is that different groups can run similar experiments in different regions at the same time. The combination of data from these different experiments can lead to results that are far greater than the sum of the results of each experiment taken individually.

Cooperation and collaboration, between scientists of different nationalities and disciplines, and between their respective Polar agencies, are key to this venture.


Starting out

All adventures start somewhere, with a single step, though it may not be easy to isolate the starting step from all the others.

This particular adventure started, for me at least, last February, when it was very naively suggested we could not let the International Polar Year go by without submitting a proposal to perform a large seismic experiment in Antarctica. From there, things started moving along with their own momentum. We wrote the project, and submitted it just before the deadline of March 1st. Then we started waiting for the verdict: funded or not funded ?

At this time, we still don't know, but like all good expeditionists, we have a backup plan. Should our large experiment not be approved, we have planned a smaller, considerably cheaper experiment which which we should be able to run with the funds we already have available.

Working in Antarctica is a logistical nightmare, as you might imagine. None of it would be possible without the logistical and financial support of specialized Polar Institutes, in particular - for us - the French Polar Institute (Institut Paul Emile Victor). The more complex the logistics, the sooner they have to be planned. We are now at the beginning of June, the Antarctic field season (which corresponds to the Antarctic summer, late October to late February) is fast approaching, and decisions have to be made.

This, for me, is where it gets real. Our experiment has suddenly jumped from being something we have planned on paper and in our heads, to something concrete. We don't yet know which of our two experiments (the large one or the small one) we'll be able to run, but we already have to buy part of the equipment, book passage on the ice-breaker that will take us to Antarctica, book space on the over-land transport that will take most of our equipment from the coast to the French/Italian base at Concordia... All this is very, very real!

The Concordia Seismic Experiment - as we have lovingly named it - has gone from residing somewhere in my brain, to being present also in my gut. It's a daunting thing, especially for me, as this will be both my first complete seismic experiment, and my visit to Antarctica.

I've set up this blog partly in order to relieve some of the tension that's building up as we prepare to make this experiment a reality, but also to share the experience with as many people as possible. I hope to convince some of my colleagues working with me on the experiment to participate in writing the blog, and I hope to entice you all to read it and send in your comments.