Showing posts with label earthquake. Show all posts

Monday, August 4, 2008

Another Antarctic Earthquake

In November of last year I wrote about an unusually large earthquake (M 5.8) that had occurred close to Casey Station in Antarctica. Earthquakes of this magnitude are rare in East Antarctica, except, it seems, in the Casey region...

Indeed, on July 23rd of this year, another large earthquake (M 5.3) occurred in the same region. The following image is from the USGS and shows the position of this event as an orange star.


This event was recorded on seismometers all over Antarctica. As examples, I have plotted the recordings of vertical ground velocity for this earthquake at stations CASY (Casey), MAW (Mawson) and PSP02 (a POLENET temporary station near South Pole).


The numbers under the station names on the above plot are distances in km from the earthquake. As you can see, the earthquake was well recorded even at distances over 2000 km.

We often say that the Antarctic plateau is virtually a-seismic, meaning there are few if any earthquakes. As you can see for this Casey event, it would be hard to miss an earthquake larger than M5 virtually anywhere on the continent. Smaller events may still be missed, however, and we do not have enough seismic stations in Antarctica (yet) to be sure that they do not occur.

Tuesday, June 17, 2008

Japan earthquake : an early warning failure?

The earthquake that occurred last Friday June 13th in Eastern Honshu, Japan - a M6.8 event according to the USGS, a M7.0 event according to JMA - occurred in a relatively lightly populated area, and caused few fatalities. Most of the damage seems to have been caused by landslides following the event (see Dave's landslide post).

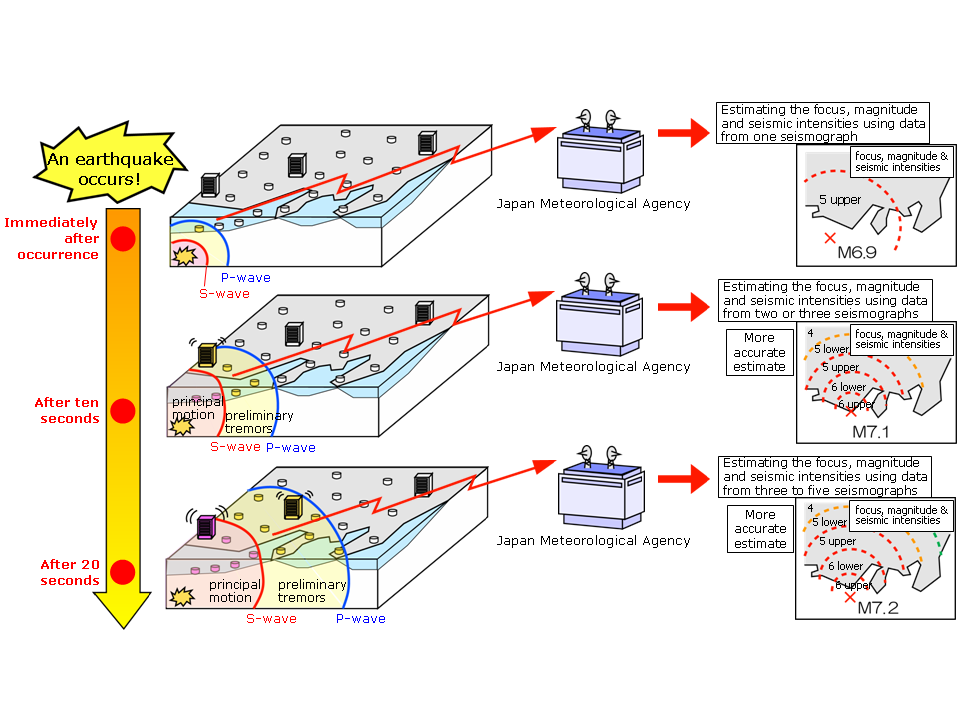
In October 2007, Japan launched its Earthquake Early Warning system, meant to give the general population advance warning of the arrival of strong shaking. The system works by picking up the fast-arriving but non-destructive P-waves, producing an estimation of the earthquake location and magnitude, and sending out a warning to the region likely to be affected by significant shaking due to S- and surface waves.

How well did the system work for the June 13 earthquake? The following information comes from a NatureNews piece that appeared on June 16th.

The early warning system signalled a powerful quake 3.5 seconds after detecting the p-waves, but at places such as Oshu within 30 kilometres of the epicentre, the s-waves had already arrived. Residents of Kurihara, one of the cities hardest hit, received only 0.3 seconds of warning. Farther away, at a distance of 50 kilometres, the warnings were issued 5 seconds before the violent shaking; residents at 80 kilometres' distance were given 15 seconds. Those relying on television, radio and mobile-phone systems to relay the message would have had to have waited an extra second longer than those with an independent terminal that can receive the broadcast warnings directly.
The NatureNews article sees the Early Warning performance as a failure, saying the "controversial" system was "beaten" by the earthquake. I would not be so negative. It will always be difficult if not impossible to give adequate warning to the area immediately surrounding the epicenter for a shallow event, as the S-waves follow the P-waves to closely for even the fastest warning system to act (and I believe 3.5 seconds from first P-wave arrival to warning is not bad at all in terms of speed). This point is indeed conceded towards the end of the piece, but by then the damage is done.

I wonder if Nature has a beef with EEW (Earthquake Early Warning)? The three news articles published on the subject since the system was launched are all negative. From a purely scientific and technical point of view, I would say the system functioned properly, within its inherent limitations. These limitations are pointed out explicitly in the documentation given to the general public. I quoted the JMA explanation of these limitations in my first EEW post. Here is a brief summary:
  1. Timing: because of the time required to process the seismic data and generate a warning, areas close to the focus of an earthquake may not receive the warning before the strong shaking occurs.
  2. False alarms: these can occur when using data from only one seismograph.
  3. Magnitude: magnitude estimates are notoriously inaccurate, especially before all the waves generated from the earthquake have arrived.
  4. Seismic intensity: intensity estimates are limited in accuracy due both to the limitations in magnitude estimation and residual uncertainties in the local amplification due to land structure.
The acceptance / confidence problems currently plaguing the Japanese EEW system are in my opinion less due to failures of the system itself than to the inherent difficulties that occur any time one deals with warnings to the general public. Even though the limitations of an automated warning system may be explained clearly, the public is rarely generous of spirit when it comes to fearful occurrences such as earthquakes. Tsunami warning systems such as that run by the PTWC are confronted with similar difficulties, especially close to the focus of tsunamigenic earthquakes.

How should one deal with the general public? What is the actual tolerance of false alarms? What is the tolerance of underestimations of damage? I do not believe there is a cut-and dried answer to any of these questions. Moreover, the answer may change with time and will probably depend on the performance history of the system. We are still in the early days of Earthquake Early Warning. Maybe a few years from now we shall have a greater handle on how to deal with these issues...

Tuesday, June 10, 2008

Earthquake cleared of causing Lusi mud volcano

It seems earthquakes have been cleared of causing the Lusi mud volcano in Indonesia:

The two-year old mud volcano called Lusi spews huge volumes of mud and has displaced more than 30,000 people and caused millions of dollars worth of damage. An international team of scientists has now concluded that it was caused by the drilling of a gas exploration well and not by an earthquake that happened two-days before the mud volcano erupted in East Java, Indonesia.
This result, contested at first and now confirmed, comes shortly after the publication in Nature Geoscience of a study suggesting earthquake triggering is a ubiquitous phenomenon, at least for earthquakes of magnitude 7. The main argument against earthquake triggering being the cause of the Lusi mud eruption is precisely a magnitude argument:
Prof Michael Manga, of University of California, Berkeley, said: “We have known for hundreds of years that earthquakes can trigger eruptions. In this case, the earthquake was simply too small and too far away.”

Read more about Lusi and its possible collapse here.

Tangjiashan quake lake

The M7.9 Sichuan earthquake of May 12th triggered a massive landslide that created a lake at Tangjiashan.

Landslide created dams are notoriously unstable, and the Chinese authorities have been trying to limit the possible damage from an uncontrolled breach of the Tangjiashan dam by cutting a sluice to evacuate the ever rising water.

It seems now that these efforts have been in vain... See Dave Petely's great series of posts on the subject.

[Thanks to Andrew and Chris for useful links into this subject.]

Monday, November 5, 2007

Antarctica Earthquake : M 5.8 "Casey"


Updated post.

There has been a large earthquake on the Antarctic continent. The USGS report gives the following updated details:

Magnitude 5.6
Sunday, November 04, 2007 at 20:35:36 UTC
Location 67.097°S, 111.316°E
Depth 10 km
Region ANTARCTICA
Distances 95 km SSE of Casey Station, Antarctica

Earthquakes on the Antarctic continent itself are extremely rare. This one is likely to be closely scrutinized by all Antarctic seismologists. Here is a Google Earth picture of the know seismicity in the region around the CASY seismic station at Casey (thanks to JJL for the script used to make this image). The image includes the latest event (left-most on the map).


Here are a couple of pictures of seismograms from CASY station. The first shows the three components of motion (vertical, north, east) for the M5.6 event. The strongest signals are saturated. The second picture shows vertical component recordings of a set of aftershocks of the main event. Although we do not have exact locations of these aftershocks, they occurred at approximately the same distance from CASY as the main event.


-----
Keep up to date with the latest developments at http://sismordia.blogspot.com

Friday, October 19, 2007

Japan - Pioneering Earthquake Early Warning

The Japanese Meteorological Agency has been testing an Earthquake Early Warning system for some time. Up until recently, the warnings were received only by certain agencies and infrastructures such train networks. As of October 1st, the JMA has started distributing these alerts to the public at large, via radio and TV.

The system provides estimates of the seismic intensities and expected arrival time of strongest motion. These estimations are based on fast determination of the location and magnitude of the earthquakes using data observed by seismometers near the epicenter.


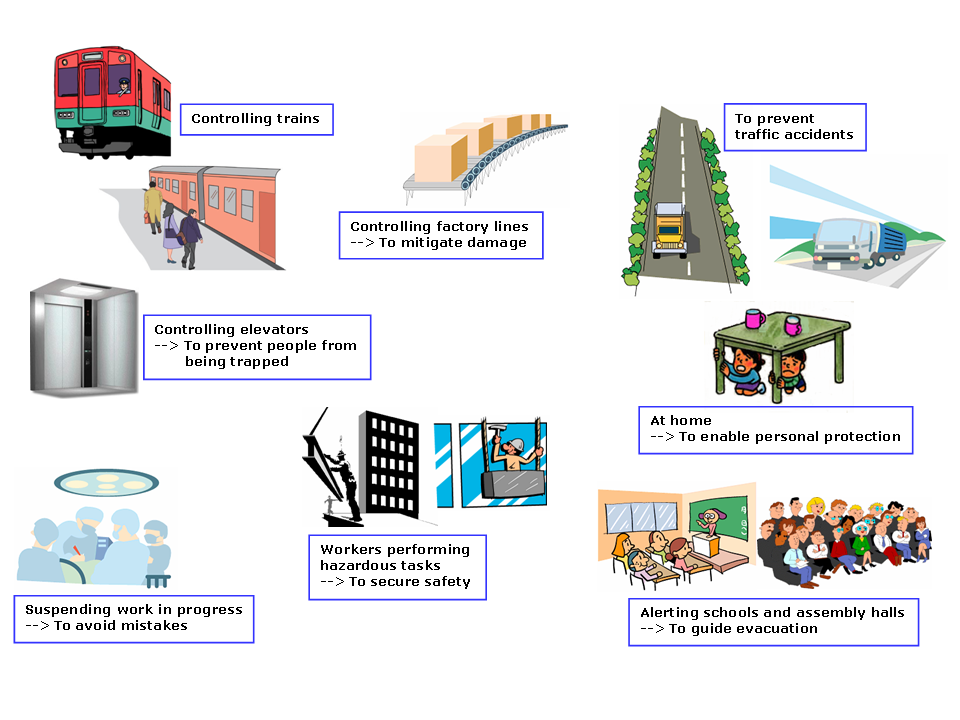
Earthquake Early Warning reduces earthquake-related damage by giving time to act in preparation to the shaking, for example by slowing down trains, controlling elevators. Now that warnings are received by the public, they will enable people to protect themselves in the appropriate manner for the location they are in.

The decision to trigger an earthquake warning is taken automatically by the EEW system, based on the information it receives from the seismic stations. There is a trade-off inherent in all alert or warning procedures, between the promptness of an alert and its accuracy: simply put, it takes time to get enough information to make an informed decision, but an alert is only useful if given sufficiently in advance.

The JMA list the following inevitable limitations to the EEW system, which have to be taken into account by the users:

Timing
The window of time from the announcement of an Earthquake Early Warning until the arrival of the main tremors is very short, i.e. a matter of seconds (or between several seconds and a few tens of seconds). In areas that are close to the focus of the earthquake, the warning may not be transmitted before strong tremors hit.

False alarms
When using data from only one seismograph, false Earthquake Early Warnings may occur as a result of noise from accidents, lightning or device failure.

Magnitude estimation
There are limits to the accuracy of estimating magnitude, especially for large earthquakes. It is difficult to separate earthquakes and provide accurate warnings when multiple earthquakes occur almost simultaneously or in close proximity to each other.

Seismic intensity estimation
There are limits to the accuracy of estimating seismic intensity by statistical attenuation formula, as well as limits to the prediction of land surface amplification.
You can read more about the EEW system on the JMA webpage, where you can also find these two leaflets explaining how the system works, and how to react to a warning.


Call for comments: Are you living in Japan, or do you know people who are? Have you (or they) had to react to an Earthquake Early Warning yet? If so, please let me know how it worked, what went through your mind, what you did to prepare for the shaking, how you felt afterwards.

-----
Keep up to date with the latest developments at http://sismordia.blogspot.com

Thursday, September 13, 2007

Another major earthquake hits Indonesia

It never rains but it pours... nowhere is this more true than in Indonesia right now. Here is the USGS ShakeMap for another major quake in the region:


The local tsunami warning for this quake issued by PTWC is available here.

-----
Keep up to date with the latest developments at http://sismordia.blogspot.com

Powerful earthquakes hit Indonesia

Indonesia was hit yesterday (Wednesday) by one great (M8.4) and one major (M7.9) earthquakes, followed by a number of strong to moderate aftershocks. News reports about the quakes can be found all over the web, but also here, here, here and here.

The various tsunami warning centers, including the Pacific Tsunami Warning Center in Hawaii, reacted immediately, sending out first preliminary warnings then tsunami reports. Mike Dunford wrote a nice post about these tsunami warnings here.

Here are the ShakeMaps (earthquake intensity maps) published by the USGS for these two earthquakes, followed by the most up-to-date tsunami bulletin by the PTWC for the larger of the two events (the PTWC has issued a warning also for the second event, available here):


TSUNAMI BULLETIN NUMBER 005
PACIFIC TSUNAMI WARNING CENTER/NOAA/NWS
ISSUED AT 1505Z 12 SEP 2007

THIS BULLETIN IS FOR ALL AREAS OF THE INDIAN OCEAN.

... FINAL INDIAN-OCEAN-WIDE TSUNAMI WATCH ...

THIS THE FINAL TSUNAMI WATCH FOR

INDONESIA / AUSTRALIA / INDIA / SRI LANKA / THAILAND / UNITED KINGDOM / MALDIVES / MYANMAR / MALAYSIA / BANGLADESH / MAURITIUS / REUNION / SEYCHELLES / MADAGASCAR / SOMALIA / OMAN / PAKISTAN / IRAN / YEMEN / COMORES / CROZET ISLANDS / MOZAMBIQUE / KENYA / TANZANIA / KERGUELEN ISLANDS / SOUTH AFRICA / SINGAPORE

THIS BULLETIN IS ISSUED AS ADVICE TO GOVERNMENT AGENCIES. ONLY NATIONAL AND LOCAL GOVERNMENT AGENCIES HAVE THE AUTHORITY TO MAKE DECISIONS REGARDING THE OFFICIAL STATE OF ALERT IN THEIR AREA AND ANY ACTIONS TO BE TAKEN IN RESPONSE.

AN EARTHQUAKE HAS OCCURRED WITH THESE PRELIMINARY PARAMETERS

ORIGIN TIME - 1110Z 12 SEP 2007
COORDINATES - 4.5 SOUTH 101.3 EAST
LOCATION - SOUTHERN SUMATERA INDONESIA
MAGNITUDE - 8.2

MEASUREMENTS OR REPORTS OF TSUNAMI WAVE ACTIVITY

GAUGE LOCATION LAT LON TIME AMPL PER
------------------- ----- ------ ----- --------------- -----
SIBOLGA ID 1.7N 98.8E 1434Z 0.09M / 0.3FT 52MIN
PADANG ID 0.9S 100.4E 1348Z 0.98M / 3.2FT 34MIN
COCOS CC 12.1S 96.9E 1236Z 0.11M / 0.4FT 22MIN
DART 23401 8.9S 88.5E 1421Z 0.02M / 0.1FT 15MIN
LAT - LATITUDE (N-NORTH, S-SOUTH)
LON - LONGITUDE (E-EAST, W-WEST)
TIME - TIME OF THE MEASUREMENT (Z IS UTC IS GREENWICH TIME)
AMPL - TSUNAMI AMPLITUDE MEASURED RELATIVE TO NORMAL SEA LEVEL.
IT IS ...NOT... CREST-TO-TROUGH WAVE HEIGHT.
VALUES ARE GIVEN IN BOTH METERS(M) AND FEET(FT).
PER - PERIOD OF TIME IN MINUTES(MIN) FROM ONE WAVE TO THE NEXT.

EVALUATION

SEA LEVEL READINGS INDICATE A TSUNAMI WAS GENERATED. IT MAY HAVE BEEN DESTRUCTIVE ALONG COASTS NEAR THE EARTHQUAKE EPICENTER.

FOR THOSE AREAS - WHEN NO MAJOR WAVES HAVE OCCURRED FOR AT LEAST TWO HOURS AFTER THE ESTIMATED ARRIVAL TIME OR DAMAGING WAVES HAVE NOT OCCURRED FOR AT LEAST TWO HOURS THEN LOCAL AUTHORITIES CAN ASSUME THE THREAT IS PASSED. DANGER TO BOATS AND COASTAL STRUCTURES CAN CONTINUE FOR SEVERAL HOURS DUE TO RAPID CURRENTS. AS LOCAL CONDITIONS CAN CAUSE A WIDE VARIATION IN TSUNAMI WAVE ACTION THE ALL CLEAR DETERMINATION MUST BE MADE BY LOCAL AUTHORITIES.

BASED ON AVAILABLE DATA THIS CENTER DOES NOT EXPECT MORE WIDESPREAD DESTRUCTIVE EFFECT. HOWEVER ... DUE TO ONLY LIMITED SEA LEVEL DATA FROM THE REGION IT MAY NOT BE POSSIBLE FOR THIS CENTER TO RAPIDLY NOR ACCURATELY EVALUATE THE STRENGTH OF A TSUNAMI IF ONE HAS BEEN GENERATED.

ESTIMATED INITIAL TSUNAMI WAVE ARRIVAL TIMES AT FORECAST POINTS WITHIN THE WARNING AND WATCH AREAS ARE GIVEN BELOW. ACTUAL ARRIVAL TIMES MAY DIFFER AND THE INITIAL WAVE MAY NOT BE THE LARGEST. A TSUNAMI IS A SERIES OF WAVES AND THE TIME BETWEEN SUCCESSIVE WAVES CAN BE FIVE MINUTES TO ONE HOUR.

LOCATION FORECAST POINT COORDINATES ARRIVAL TIME
-------------------------------- ------------ ------------
INDONESIA BENGKULU 3.9S 102.0E 1123Z 12 SEP
SIBERUT 1.5S 98.7E 1203Z 12 SEP
PADANG 0.9S 100.1E 1214Z 12 SEP
BANDAR LAMPUNG 5.7S 105.3E 1242Z 12 SEP
SIMEULUE 2.5N 96.0E 1243Z 12 SEP
CILACAP 7.8S 108.9E 1307Z 12 SEP
BANDA ACEH 5.5N 95.1E 1329Z 12 SEP
BALI 8.7S 115.3E 1345Z 12 SEP
KUPANG 10.0S 123.4E 1453Z 12 SEP
BELAWAN 3.8N 99.0E 1703Z 12 SEP
AUSTRALIA CHRISTMAS IS 10.4S 105.4E 1220Z 12 SEP
COCOS ISLAND 12.1S 96.7E 1234Z 12 SEP
NORTH WEST CAPE 21.5S 113.9E 1429Z 12 SEP
CAPE INSPIRATIO 25.9S 113.0E 1526Z 12 SEP
CAPE LEVEQUE 16.1S 122.6E 1542Z 12 SEP
PERTH 32.0S 115.3E 1545Z 12 SEP
AUGUSTA 34.3S 114.7E 1559Z 12 SEP
GERALDTOWN 28.6S 114.3E 1603Z 12 SEP
ESPERANCE 34.0S 121.8E 1726Z 12 SEP
KINGSTON SOUTH 37.0S 139.4E 1906Z 12 SEP
EUCLA MOTEL 31.8S 128.9E 1934Z 12 SEP
DARWIN 12.1S 130.7E 1948Z 12 SEP
HEARD ISLAND 54.0S 73.5E 1955Z 12 SEP
HOBART 43.3S 147.6E 2015Z 12 SEP
INDIA GREAT NICOBAR 7.1N 93.6E 1338Z 12 SEP
LITTLE ANDAMAN 10.7N 92.3E 1421Z 12 SEP
PORT BLAIR 12.0N 92.5E 1440Z 12 SEP
NORTH ANDAMAN 13.3N 92.6E 1453Z 12 SEP
CHENNAI 13.4N 80.4E 1540Z 12 SEP
KAKINADA 17.2N 82.7E 1604Z 12 SEP
TRIVANDRUM 8.3N 76.9E 1608Z 12 SEP
BALESHWAR 21.6N 87.3E 1701Z 12 SEP
MANGALORE 13.3N 74.4E 1732Z 12 SEP
BOMBAY 18.8N 72.6E 2005Z 12 SEP
GULF OF KUTCH 22.7N 68.9E 2019Z 12 SEP
SRI LANKA DONDRA HEAD 5.8N 80.5E 1447Z 12 SEP
TRINCOMALEE 8.7N 81.3E 1502Z 12 SEP
COLOMBO 6.9N 79.8E 1515Z 12 SEP
JAFFNA 9.9N 80.0E 1625Z 12 SEP
THAILAND PHUKET 8.0N 98.2E 1508Z 12 SEP
KO PHRA THONG 9.1N 98.2E 1554Z 12 SEP
KO TARUTAO 6.6N 99.6E 1626Z 12 SEP
UNITED KINGDOM DIEGO GARCIA 7.3S 72.4E 1526Z 12 SEP
MALDIVES GAN 0.6S 73.2E 1528Z 12 SEP
MALE 4.2N 73.6E 1544Z 12 SEP
MINICOV 8.3N 73.0E 1614Z 12 SEP
MYANMAR PYINKAYAING 15.8N 94.2E 1537Z 12 SEP
CHEDUBA ISLAND 18.9N 93.4E 1554Z 12 SEP
SITTWE 20.0N 92.9E 1629Z 12 SEP
MERGUI 12.8N 98.4E 1647Z 12 SEP
YANGON 16.2N 96.5E 1713Z 12 SEP
MALAYSIA GEORGETOWN 5.4N 100.1E 1704Z 12 SEP
PORT DICKSON 2.5N 101.7E 2048Z 12 SEP
BANGLADESH CHITTAGONG 22.5N 91.2E 1801Z 12 SEP
MAURITIUS PORT LOUIS 20.0S 57.3E 1803Z 12 SEP
REUNION ST DENIS 20.8S 55.2E 1820Z 12 SEP
SEYCHELLES VICTORIA 4.5S 55.6E 1847Z 12 SEP
MADAGASCAR TOAMASINA 17.8S 49.8E 1900Z 12 SEP
ANTSIRANANA 12.1S 49.5E 1905Z 12 SEP
MANAKARA 22.2S 48.2E 1919Z 12 SEP
CAP STE MARIE 25.8S 45.2E 2009Z 12 SEP
MAHAJANGA 15.4S 46.2E 2009Z 12 SEP
TOLIARA 23.4S 43.6E 2034Z 12 SEP
SOMALIA HILALAYA 6.5N 49.2E 1922Z 12 SEP
CAPE GUARO 11.9N 51.4E 1933Z 12 SEP
MOGADISHU 2.0N 45.5E 1938Z 12 SEP
KAAMBOONI 1.5S 41.9E 2004Z 12 SEP
OMAN SALALAH 17.0N 54.2E 1930Z 12 SEP
DUQM 19.7N 57.8E 1939Z 12 SEP
MUSCAT 23.9N 58.6E 1943Z 12 SEP
PAKISTAN GWADAR 25.1N 62.4E 1937Z 12 SEP
KARACHI 24.7N 66.9E 2031Z 12 SEP
IRAN GAVATER 25.0N 61.3E 1943Z 12 SEP
YEMEN AL MUKALLA 14.5N 49.2E 2003Z 12 SEP
ADEN 13.0N 45.2E 2100Z 12 SEP
COMORES MORONI 11.6S 43.3E 2006Z 12 SEP
CROZET ISLANDS CROZET ISLANDS 46.4S 51.8E 2009Z 12 SEP
MOZAMBIQUE CABO DELGADO 10.7S 40.7E 2034Z 12 SEP
ANGOCHE 15.5S 40.8E 2044Z 12 SEP
QUELIMANE 18.0S 37.1E 2213Z 12 SEP
MAPUTO 25.9S 32.8E 2218Z 12 SEP
BEIRA 19.9S 35.1E 2246Z 12 SEP
KENYA MOMBASA 4.0S 39.7E 2039Z 12 SEP
TANZANIA LINDI 9.8S 39.9E 2039Z 12 SEP
DAR ES SALAAM 6.7S 39.4E 2047Z 12 SEP
KERGUELEN ISLAN PORT AUX FRANCA 49.0S 69.2E 2049Z 12 SEP
SOUTH AFRICA PRINCE EDWARD I 46.6S 37.6E 2146Z 12 SEP
DURBAN 29.8S 31.2E 2205Z 12 SEP
PORT ELIZABETH 33.9S 25.8E 2256Z 12 SEP
CAPE TOWN 34.1S 18.0E 2359Z 12 SEP
SINGAPORE SINGAPORE 1.2N 103.8E 0048Z 13 SEP

THE JAPAN METEOROLOGICAL AGENCY MAY ISSUE ADDITIONAL INFORMATION FOR THIS EVENT. IN THE CASE OF CONFLICTING INFORMATION...THE MORE CONSERVATIVE INFORMATION SHOULD BE USED FOR SAFETY.


-----
Keep up to date with the latest developments at http://sismordia.blogspot.com

Wednesday, September 12, 2007

Earthquake magnitude or earthquake intensity?

As a seismologist, I am pretty used to dealing with the dual concepts of earthquake magnitude and earthquake intensity. Magnitude quantifies the energy released by the earthquake. Intensity quantifies the ground shaking at a particular location. These concepts are so bread-and-butter to me that I sometimes forget how many people get them confused when listening to reports of earthquakes on the news media.

Nowadays, news media usually get their reporting pretty straight, thanks also to the improved communication coming out of seismological laboratories around the world. Guidelines and explanations are routinely offered now to the media whenever an earthquake occurs. Here is an excerpt from what the USGS puts online after every major earthquake:

Magnitude is the number (for example, 7.1) that represents the energy released in an earthquake; a single number representing magnitude is assigned to each earthquake. Intensity, on the other hand, is a measure of how the ground shook at a particular site. So, while an earthquake has one magnitude and one epicenter, it produces a range of ground shaking levels at sites throughout the region. These different intensities depend on distance from the earthquake, the rock and soil conditions at geographical sites, and variations in the propagation of seismic waves from the earthquake due to complexities in the structure of the Earth's crust.
Earthquake intensity is estimated both from instrumental records and from the reports of people who have felt the earthquake.  It is often reported in the form of a map, showing intensity as a function of position.   You can often report feeling an earthquake by filling in an online form (in the US these forms are provided by the USGS, in France they are provided by the BCSF). Intensity values are given using the following scale, the Modified Mercalli Intensity Scale:

I  -  People do not feel any earth movement.

II  -  Felt by persons at rest, on upper floors of tall buildings

III   -  Felt by people indoors. Hanging objects swing back and forth. Vibration from the earthquake may seem like the passing of light trucks. May not be recognized as an earthquake.

IV   -  Hanging objects swing. Vibration may seem like the passing of heavy trucks or a jolt, like a heavy ball striking the walls. Parked vehicles may rock noticeably. Windows, dishes, doors may rattle and glasses clink. In the upper range of IV, walls of wood frame buildings may creak.

V  -  Almost everyone feels movement whether inside or outdoors. Sleeping people are awakened. Liquids in containers are disturbed; some are spilled. Small unstable objects are displaced or overturned. Doors swing, close, or open. Shutters, pictures on the wall move.

VI  -  Felt by all; some are frightened and take cover. People have difficulty walking due to motion. Objects fall from shelves and dishes, glassware and ceramics may be broken. Pictures fall off walls. Furniture moves or is overturned. Weak plaster and masonry cracked. Damage slight in poorly constructed buildings. Trees, bushes shaken visibly or are heard rustling.

VII   -   People have difficulty standing. Drivers on the road feel their cars shaking. Furniture may be overturned and broken. Loose bricks fall from buildings and masonry walls and cracks in plaster and masonry may appear. Weak chimneys may break at the roofline. Damage is slight to moderate in well-built structures; considerable in poorly constructed buildings and facilities.

VIII   -   Drivers have trouble steering. Tall structures such as towers, monuments and chimneys may twist and fall. Wood frame houses that
are not bolted to their foundations may shift and sustain serious damage. Damage is slight to moderate in well-constructed buildings, considerable in poorly constructed buildings. Branches are broken and fall from trees. Changes occur in flow or temperature of springs and wells. Cracks appear in wet ground and on steep slopes.

IX  -   Masonry structures and poorly constructed buildings suffer serious damage or collapse. Frame structures, if not bolted, shift off foundations. Serious damage to reservoirs. Underground pipes broken. Conspicuous cracks in the ground. In alluvial areas, sand and mud ejected and sand craters are formed.

X  -   Most masonry and frame structures destroyed along with their foundations. Some well-built wooden structures and bridges are destroyed. Serious damage to dams, dikes, and embankments. Large landslides occur. Water thrown on the banks of canals, rivers and lakes. Sand and mud shift horizontally on beaches and flat land. Rails bent.

Thursday, August 16, 2007

Featured earthquakes #3 : Peru

M8.0 Near the Coast of Central Peru.

This large earthquake occurred on Wednesday, August 15, 2007 at 23:40:56 UTC, at 30.2 km depth. It was 45 km (25 miles) WNW of Chincha Alta, Peru and 150 km (95 miles) SSE of LIMA, Peru.

At the time of this writing, the earthquake is known to have claimed some 330 lives, and have injured over 1300 people. You can read more up-to-date news agency reports about this earthquake: Reuters, BBC, CNN.


Here is the USGS ShakeMap for this event. It shows the intensity of shaking induced by the earthquake. It reaches very strong / severe level near the fault plane (which is shown by a black rectangle).
This earthquake occurred in a region known for its large magnitude events. The tectonic information that follows comes directly from the USGS web-page on this event.

The August 15 shock originated near the source of two earthquakes, both in the magnitude 8 range, that occurred in 1908 and 1974. This earthquake is south of the source of a magnitude 8.2 earthquake that occurred in northern Peru in 1966 and it is north of the magnitude 8.3 earthquake that occurred in 2001 near Arequipa, Peru.

The largest earthquake along the coast of Peru is the magnitude 9 that occurred in 1868. The 1868 earthquake produced a tsunami that killed several thousand people along the South American coast and also caused damage in Hawaii.
For those of you who like to look at seismograms, here are some of the records for this event taken from Rapid Earthquake View.


-----
Keep up to date with the latest developments at http://sismordia.blogspot.com

Featured earthquakes #2 : Kerguelen


As promised in this post a while back, here is a short post about the M5.2 event that occurred on the island of Kerguelen at the end of July.

Kerguelen is a volcanic island in the Southern Pacific ocean. Its "known" seismicity is very low. However, as it is in a region with very few seismic stations, "low seismicity" may also mean low-level seismicity that is too small to be recorded on a sensible number of stations.

The M5.2 Kerguelen Island event was recorded on many seismographs of the global network, and is therefore reasonably well located. One of the stations that recorded the event is PAF (Port aux Francais) which is located on Kerguelen itself.

The PAF station also located several aftershocks. You can see the records for these aftershocks in the following images. The seismograms show vertical component of motion, high-pass filtered at 2 seconds.

The first figure shows the main-shock record in red, followed by the aftershocks recorded on the first day in black.

The second shows the main-shock again, followed by the aftershocks recorded on days 2 to 10 after the event.
Note how similar the aftershocks are to each other and to the main-shock.

-----
Keep up to date with the latest developments at http://sismordia.blogspot.com

Tuesday, July 3, 2007

Featured organizations #1 : GeoHazards International


GeoHazards International is a Non Governmental Organization (NGO) with a mission:

To reduce death and suffering - particularly among children - due to earthquakes and other natural hazards in the world's most vulnerable communities through advocacy, preparedness, prevention and mitigation.

This mission is entirely independent of political, business, religious or research agendas. It is achieved through a combination of international assistance and local responsibility. Recognition of risk and of the methods used to manage it, are central to the way GHI helps vulnerable communities reduce death and injury. Communities are made safer because GHI

  1. raises awareness of risk;
  2. builds local institutions to manage that risk;
  3. strengthens schools, thereby protecting and training the communities' future generations.
GHI is managed by a small Board of Trustees, which includes specialists in earthquake and natural hazards. Technical guidance is provided by a group of international experts in the earthquake risk of developing countries, that form GHI's Board of Advisors. Day-to-day operations are performed by a small group of GHI Staff, who are based in Palo Alto, California.

Despite such a small team, the GeoHazards International has successfully run a number of hazard-mitigation projects. They are currently running projects in
Delhi (Earthquake Safety Initiative for Lifeline Buildings) and Dharamsala (both are in India).

GHI invite all people committed to helping reduce death and injury due to earthquakes in the world's most vulnerable communities to become a member of their organization.

For the whole month of July 2007, you can also contribute to GHI by voting for them on the Educated Earth donation poll.


-----
Keep up to date with the latest developments at http://sismordia.blogspot.com

Wednesday, June 27, 2007

How To Rapidly View Earthquake Records

Most of you have at one time or another heard on the news that an earthquake has happened somewhere in the world. A number of you have even felt one. If you'd like to view what seismologists see when an earthquake occurs, read on, as I run you through using Rapid Earthquake Viewer.

Start by visiting the REV site: http://rev.seis.sc.edu/index.html. You will be see a page like this:


There are two buttons on this page: Earthquake View and Station View. I would encourage you to play with all the possibilities offered by the site. Here, I will show you how to use the Earthquake View. When you click on the button, you will reach the page shown below (the page you see will not necessarily be identical to that shown here, as the page displays a dynamic collection of recent moderate to large earthquakes).


To choose an earthquake, click on the map. If there are multiple earthquakes near the one you have chosen, you will be presented with a short list from which to choose. Once you have selected your earthquake, you will be taken to its display page.

This page is divided into three main sections, only two of which are shown in the picture above.

  1. On the left you have the ID card of the earthquake (it's origin time, magnitude, location and depth) together with a map containing the earthquake location and those of a number of seismic stations.
  2. On the right you have a record section. On this plot, time increases upwards, and the seismograms are plotted according to the distance of the seismic station from the earthquake. Note how the shape of the seismogram changes with distance. Seismologists use these differences to determine the location of the earthquake.
  3. On the bottom (not shown) you have a list of the stations used to plot the record section. You can add stations by selecting them from the Add a station drop down.
If you click on one of the station names in the bottom panel, you reach another page, showing the three components (up-down, north-south, east-west) of the ground motion recorded at the station. On this plot you can see the units of ground motion, which is in fact the ground velocity measured in microns/sec (1 micron = 1/1000 of a millimeter).

From this page you can save the seismograms as a pdf file. You can also overlay the predicted arrival times of primary (P) and secondary (S) seismic waves, and zoom in on the seismograms.

The Rapid Earthquake Viewer website has many other options, which I encourage you to discover yourself. You can also work through the following pdf file from IRIS: Rapid Earthquake Viewer (REV) Activity: "Did The Earth Shake Where You Live?"

Don't forget to let me know you how you get on !

-----
Keep up to date with the latest developments at http://sismordia.blogspot.com

Sunday, June 24, 2007

Featured earthquakes #1

As soon as I write about earthquakes surrounding Antarctica, a nice one occurs right on cue, a M5.8 on the Southern Mid-Atlantic Ridge.

Origin time: Sunday, June 24, 2007 at 00:25:18 (UTC). Location: 55.574°S, 2.763°W.

It wasn't felt by anyone, it did not make the news. This is not unusual for earthquakes: many more occur than are ever felt or talked about. If we know about them at all it is thanks to the global seismic network.

As with all earthquakes larger than magnitude 5, you can read all the details on the USGS website. The link for this earthquake is here: M5.8 Southern Mid Atlantic Ridge.

You can find all the available data for this earthquake on the IRIS website. The following is a vertical component seismogram recorded at the Antarctic seismic station CASY.


-----
Keep up to date with the latest developments at http://sismordia.blogspot.com

Thursday, June 21, 2007

Antarctica : surrounded by earthquakes

If you're thinking: "Earthquakes in Antarctica? I did not think there were any!" you'd not be far wrong.

Although there are a few seismic events in Antarctica, these are generally small in magnitude, and often remain undetected by the global seismic network. Indeed, one of the objectives of running seismic experiments in Antarctica during the International Polar Year is to detect more of these earthquakes.

Although Antarctica is not itself particularly seismically active, it is, however, completely surrounded by earthquakes.

You may already have heard of the "ring of fire", that surrounds the Pacific ocean. It is made up of subduction zones that are capable of producing very large earthquakes. Antarctica has its own, much weaker ring of earthquakes, as you can see in the seismicity map that accompanies this post. These earthquakes are produced by a network of mid-ocean ridges that completely surround the continent, and that can generate moderate to large earthquakes.

For a seismologist, being surrounded by earthquakes is a great advantage. Each earthquake acts as a light bulb, illuminating the Earth, and enabling us to study its structure. Improving our knowledge of Earth structure is one of the main objectives of our seismology experiment (see Concordia Antarctic Seismic Experiment). I'll be developing this idea further in future posts.

[Image: constructed using Seismicity Viewer, a java applet written by Anthony Lomax, a fellow seismologist.]

-----
Keep up to date with the latest developments at Sismordia - Seismology at Concordia